Artículo
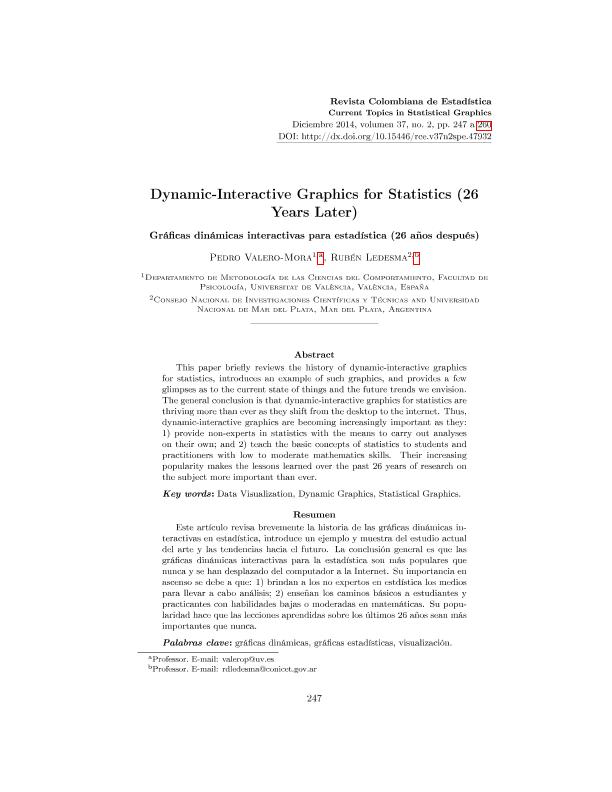
This paper briefly reviews the history of dynamic-interactive graphicsfor statistics, introduces an example of such graphics, and provides a fewglimpses as to the current state of things and the future trends we envision.The general conclusion is that dynamic-interactive graphics for statistics arethriving more than ever as they shift from the desktop to the internet. Thus,dynamic-interactive graphics are becoming increasingly important as they: 1) provide non-experts in statistics with the means to carry out analyses on their own; and 2) teach the basic concepts of statistics to students and practitioners with low to moderate mathematics skills. Their increasingpopularity makes the lessons learned over the past 26 years of research on the subject more important than ever. Este artículo revisa brevemente la historia de las gráficas dinámicas interactivas en estadística, introduce un ejemplo y muestra del estudio actual del arte y las tendencias hacia el futuro. La conclusión general es que las gráficas dinámicas interactivas para la estadística son más populares que nunca y se han desplazado del computador a la Internet. Su importancia en ascenso se debe a que: 1) brindan a los no expertos en estadística los medios para llevar a cabo análisis; 2) enseñan los caminos básicos a estudiantes y practicantes con habilidades bajas o moderadas en matemáticas. Su popularidad hace que las lecciones aprendidas sobre los últimos 26 años sean más importantes que nunca.
Dynamic-Interactive Graphics for Statistics (26 years later)
Fecha de publicación:
12/2014
Editorial:
Universidad Nacional de Colombia
Revista:
Revista Colombiana de Estadística
ISSN:
0120-1751
Idioma:
Inglés
Tipo de recurso:
Artículo publicado
Clasificación temática:
Resumen
Palabras clave:
Data-Visualization
,
Dynamic-Graphics
,
Statistics
Archivos asociados
Licencia
Identificadores
Colecciones
Articulos(CCT - MAR DEL PLATA)
Articulos de CTRO.CIENTIFICO TECNOL.CONICET - MAR DEL PLATA
Articulos de CTRO.CIENTIFICO TECNOL.CONICET - MAR DEL PLATA
Citación
Valero Mora, Pedro; Ledesma, Ruben Daniel; Dynamic-Interactive Graphics for Statistics (26 years later); Universidad Nacional de Colombia; Revista Colombiana de Estadística; 37; 2; 12-2014; 247-260
Compartir
Altmétricas


